Send Weekly Sales Digest to Management
A sales team in a manufacturing company records orders in Dataverse. They need a Week-to-date (WTD) sales digest that refreshes daily and is emailed with a snapshot chart plus a link to the full report stored in SharePoint.
Build a Doc Actions Used
- Convert Excel Document: Fill an Excel template with the current week’s data to produce the digest file
- Render Excel Chart: Extract the digest chart as a base64 PNG for email embedding
- Convert HTML: Inject metadata, the chart image, and a link into an HTML email template
Each run regenerates the digest, extracts the chart, builds the email body, and sends it.
End Goals
- Generate and update the Week-to-date Sales Digest Excel file every day with the latest sales data from Dataverse
- Send an email with the latest digest chart embedded in the email body and a link to the full digest file
Prerequisites
You’ll need:
-
A Power Platform environment with Power Automate and Dataverse
-
Dataverse tables with sales data:
Products table
Column name Data type Name Text Unit Price Currency Sales table
Column name Data type Date Date Product Lookup (to Products) Business Name Text (or Lookup to Customer) Units Sold Number Discount (% off) Number -
SharePoint site and document library to store templates and output files
-
Access to the Build a Doc connector in Power Automate (see Generate an API Key)
-
Microsoft 365 Outlook with send permissions
Author Templates
Build a Doc templates define the structure, formula slots and data slots of your documents in order to allow dynamic data population and calculation on render.
Detailed template authoring instructions can be found on Excel Template Syntax and HTML Template Syntax pages in the Reference section.
For this scenario, you need to create two templates:
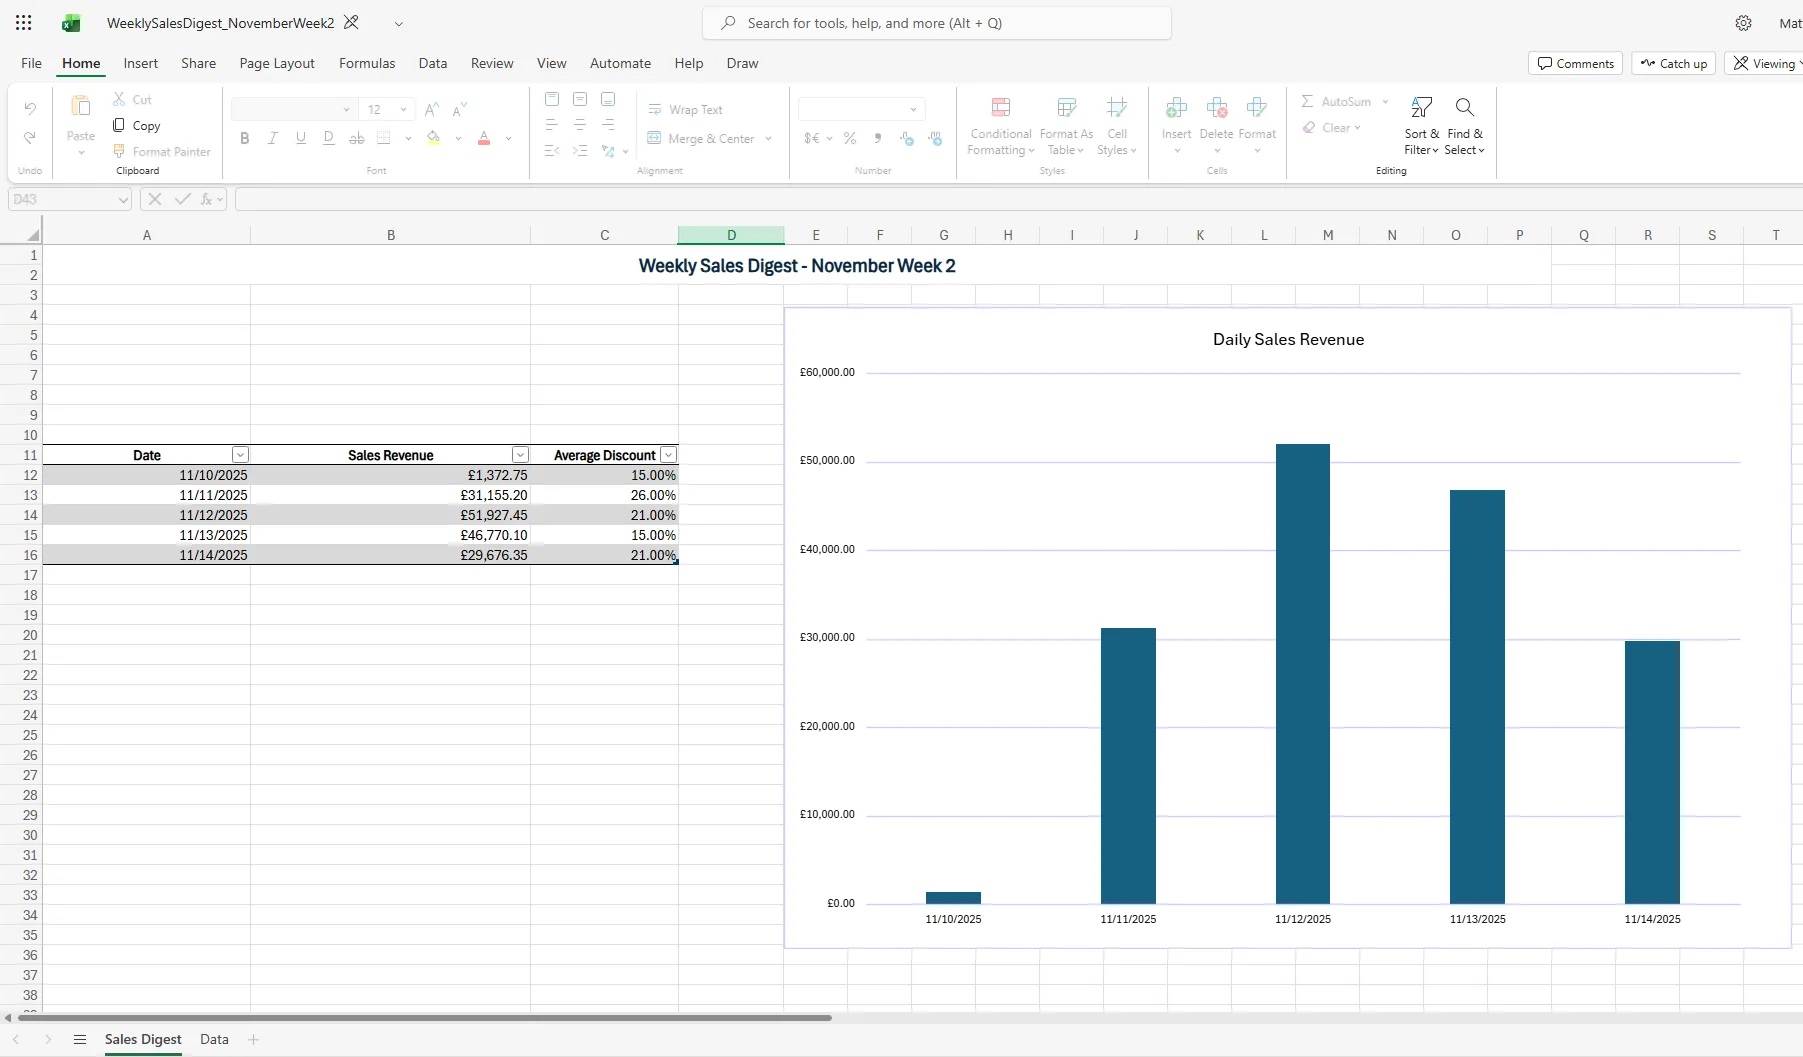
Excel Template - Week-to-date Sales Digest
This template defines 2 worksheets: Sales Digest and Data.
Sales Digest worksheet contains:
- Title of the sales digest, containing dynamic month and week number
- Digest table that calculates sales revenue and average discount for each day of the week
- Digest chart that visualises the digest data
Data worksheet contains:
- Data table that formats and stores the raw sales records from Dataverse
HTML Email Template
This template defines the structure and styling of the email body, and includes slots for dynamic data population.
See HTML Template Syntax for more details.
Implementation Steps
-
Create a new Excel file with 2 worksheets: Sales Digest and Data.
-
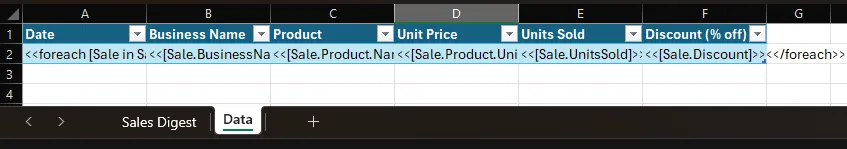
In the Data worksheet:
-
Create a table with the following headers in row 1 and template expressions in row 2:
Date Business Name Product Unit Price Units Sold Discount (% off) <<foreach [Sale in Sales]>><<[Sale.Date]>> <<[Sale.BusinessName]>> <<[Sale.Product.Name]>> <<[Sale.Product.UnitPrice]>> <<[Sale.UnitsSold]>> <<[Sale.Discount]>><</foreach>> -
On the Table Design tab in the toolbar, define the table name as _salesData.
-
This table will be populated with raw sales records from Dataverse on render.
-
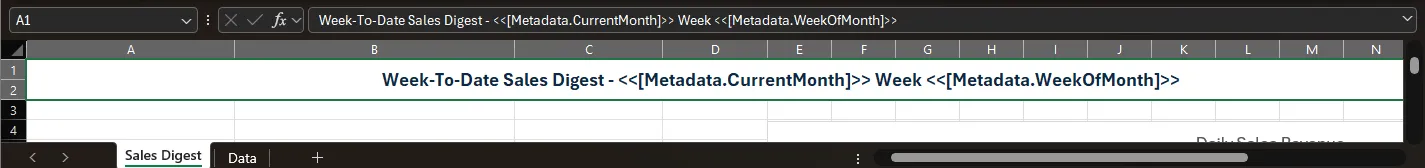
- Create a Title region in Sales Digest worksheet:
- Merge multiple cells into a title text box at the top and apply suitable formatting.
- Define the area as a named range _title.
- Add content:
Week-to-date Sales Digest - <<Metadata.CurrentMonth>> Week <<Metadata.WeekOfMonth>>- The data slots will be populated dynamically based on the
Metadatadata source.
e.g.Week-to-date Sales Digest - November Week 2
- The data slots will be populated dynamically based on the
-
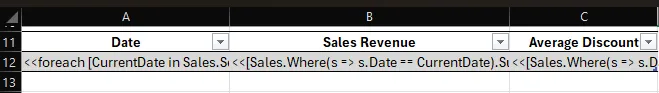
Create the Digest Table template region in Sales Digest worksheet:
-
Create a table with the following headers in row 3:
Date,Total Sales Revenue,Average Discount (%) -
In the first data row, add this template row to populate the table dynamically:
Date Sales Revenue Average Discount (%) <<foreach [CurrentDate in Sales.Select(s=>s.Date).Distinct()]>> <<[CurrentDate]>> <<[Sales.Where(s => s.Date == CurrentDate).Sum(s=>s.UnitsSold * s.Product.UnitPrice * (1 - s.Discount / 100.0))]>> <<[Sales.Where(s => s.Date == CurrentDate).Average(s=>s.Discount)]>>% <</foreach>> -
A quick summary of the expressions above:
- The
foreachiterates over distinct dates in theSalesdata source (CurrentDate). <<[CurrentDate]>>prints the date for each row.- The
Sum(...)expression computes total sales revenue for that date by summingUnitsSold * Product.UnitPrice * (1 - Discount/100)across matching sales. - The
Average(...)expression computes the average discount for that date.
- The
- On Table Design tab in the toolbar, define the table name as _salesDigest.
-
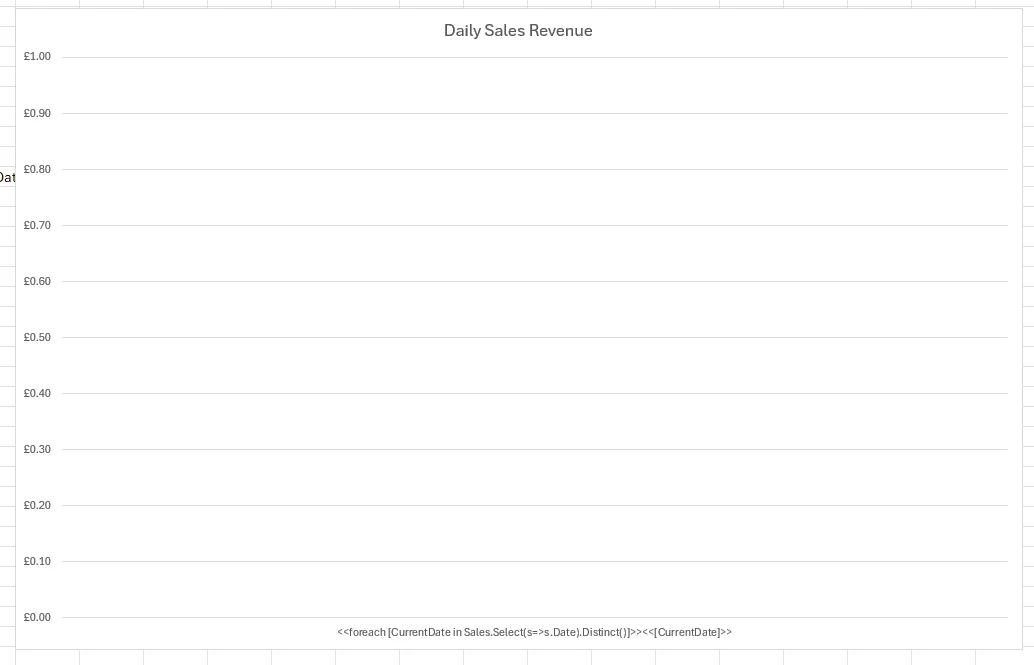
- Create the chart in Sales Digest worksheet:
-
Insert a cluster column chart, name it SalesRevenueChart in the toolbar.
-
Define data range for the chart:
- Open Name Manager from the Formulas tab in the toolbar.
- Create new Name
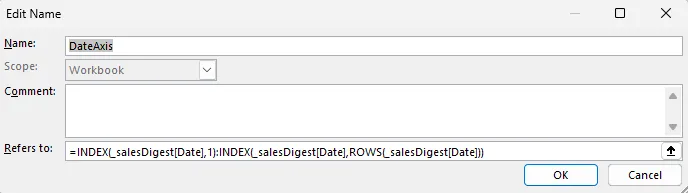
DateAxis, enter the following into the Refers to field:
=INDEX(_salesDigest[Date],1):INDEX(_salesDigest[Date],ROWS(_salesDigest[Date])) - Create new Name
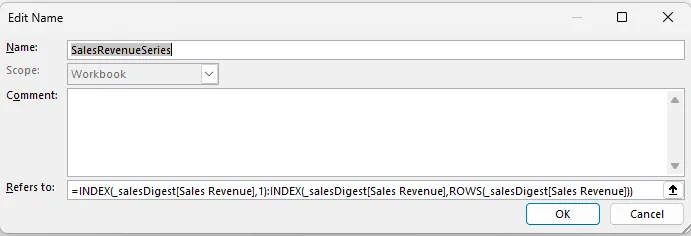
SalesRevenueSeries, enter the following into the Refers to field:
=INDEX(_salesDigest[Sales Revenue],1):INDEX(_salesDigest[Sales Revenue],ROWS(_salesDigest[Sales Revenue]))
-
Right click on the chart and select Select Data.
-
In the Select Data Source dialog, under Legend Entries (Series), click Add.
-
In the Edit Series dialog:
- Series name: Enter
Sales Revenue. - Series values: Enter
=YourFileName.xlsx!SalesRevenueSeries.
- Series name: Enter
-
Click OK.
-
Under Horizontal (Category) Axis Labels, click Edit.
-
In the Axis Labels dialog:
- Axis label range: Enter
=YourFileName.xlsx!DateAxis.
- Axis label range: Enter
-
Click OK to close all dialogs.
-

You should now have:
- A Sales Digest worksheet with title, digest table template and chart.
- A Data worksheet to store raw sales records.
- 5 named ranges:
_title,_salesDigest,DateAxis,SalesRevenueSeries.
Refer to Excel Template Syntax for more details.
HTML Email Template - Email Body
This template defines the structure and styling of the email body, and includes slots for dynamic data population.
Refer to HTML Template syntax for more details.
Here is a sample HTML email template for the Week‑to‑date Sales Digest:
<html lang="en">  <head>    <meta charset="utf-8" />    <title>Week‑to‑date Sales Digest</title>  </head>  <body    style="margin:0; padding:20px; background-color:#f8f9fa; font-family:Arial,sans-serif; color:#333;"  >    <table      width="100%"      cellpadding="0"      cellspacing="0"      border="0"      bgcolor="#f8f9fa"    >      <tr>        <td align="center">          <table            width="600"            cellpadding="20"            cellspacing="0"            border="0"            bgcolor="#ffffff"            style="border:1px solid #ddd;"          >            <tr>              <td>                <h2 style="font-size:18px; color:#222; margin-bottom:10px;">                  Week‑to‑date Sales Digest                </h2>
                <p style="font-size:14px; line-height:1.5; margin:10px 0;">                  Hi,                </p>                <p style="font-size:14px; line-height:1.5; margin:10px 0;">                  Your week‑to‑date sales digest for {{Metadata.CurrentMonth}}                  week {{Metadata.WeekOfMonth}} is updated. Here’s a quick                  summary:                </p>                <!-- Base64 chart -->                <img                  src="data:image/png;base64,{{Base64ChartData}}"                  alt="Week‑to‑date sales chart"                  style="max-width:100%; height:auto; border:1px solid #ddd; margin:15px 0;"                />
                <p style="font-size:14px; line-height:1.5; margin:10px 0;">                  Please refer to                  <a                    href="{{DigestUrl}}"                    style="color:#1a73e8; text-decoration:underline;"                    >Week‑to‑date Sales Digest</a                  >                  for the full breakdown.                </p>
                <p                  style="font-size:12px; color:#777; text-align:center; margin-top:20px; border-top:1px solid #eee; padding-top:10px;"                >                  Build a Doc Automation                </p>              </td>            </tr>          </table>        </td>      </tr>    </table>  </body></html>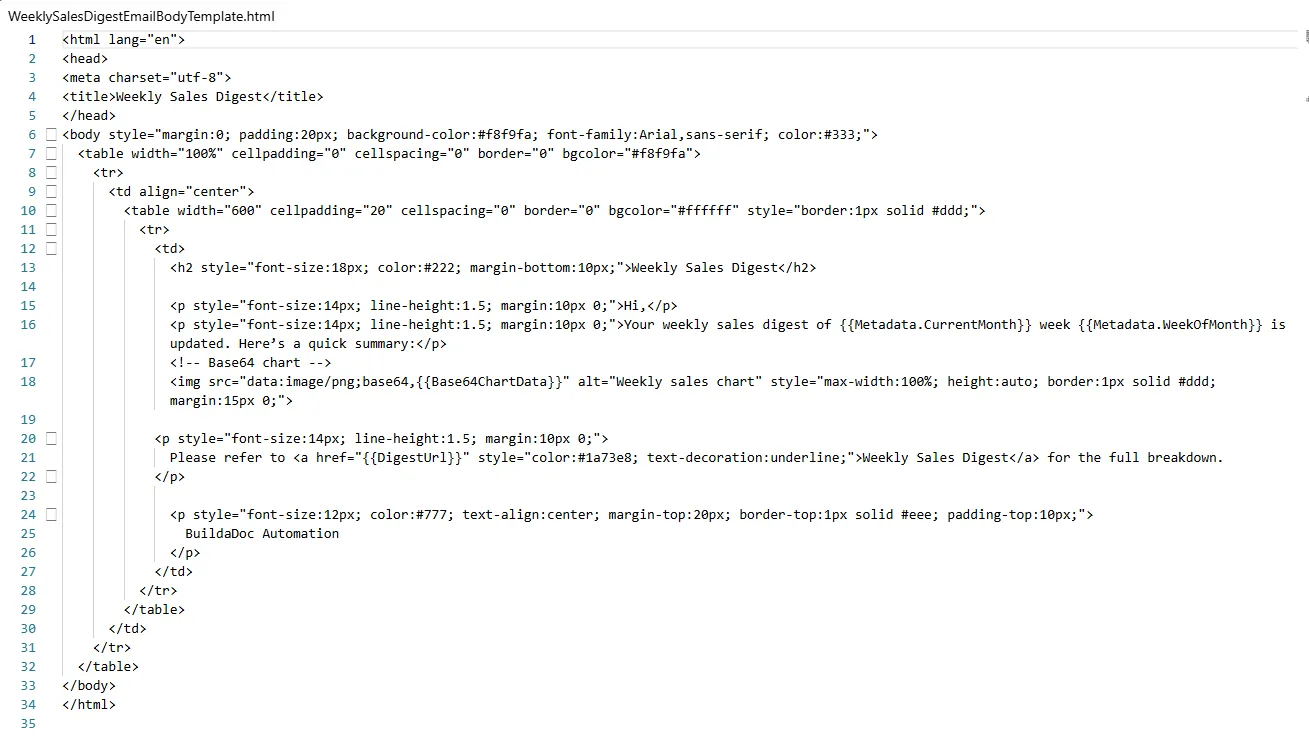
Implement Power Automate flow
1. Trigger
We want to run this flow daily at 8 AM so the Week‑to‑date Sales Digest is updated every morning.
- Set
Recurrenceas trigger.- Interval: 1
- Frequency: Day
- At these hours: e.g., 8 (for 8 AM)
2. Define Digest context and initialise variables
Define digest context
Define digest context for this run by adding a Compose action for each name below and using the matching expression as the input.
| Name | Inputs | Note |
|---|---|---|
| Current Month | formatDateTime(convertFromUtc(utcNow(), 'GMT Standard Time'), 'MMMM') | |
| First Monday of Month | addDays(startOfMonth(utcNow()), mod(sub(8, dayOfWeek(startOfMonth(utcNow()))), 7)) | |
| Week of the Month | add(div(sub(dayOfMonth(utcNow()), dayOfMonth(outputs('First_Monday_of_month'))), 7), 1) | |
| Start Date | addDays(outputs('First_Monday_of_month'), mul(sub(outputs('Week_of_the_Month'), 1), 7)) | Monday of current week |
| End Date | addDays(outputs('Start_Date'), 6) | Sunday of current week |
| File Base Name | WeeklySalesDigest_@{outputs('Current_Month')}Week@{outputs('Week_of_the_Month')} | Output sample: WeeklySalesDigest_NovemberWeek2 |
3. Retrieve Sales Records
We want to update the Sales Digest with data from Monday of current week to yesterday.
- Add a Dataverse
List rowsaction.- Table name: Sales (or your equivalent table)
- Filter rows:
hw_date ge @{outputs('Start_Date')} and hw_date lt @{startOfDay(utcNow())} - Sort By:
hw_date asc
4. Build up Sales Records data object
To build up the Sales Records array, we need to go through records retrieved from previous steps and append the data into Sales Records array, including the related Product info.
Steps:
-
Add an
Apply to eachaction to loop through the sales records from previous step.- Assuming you’ve named your loop action
Apply to each - Sales records, the current sale will be referenced asitems('Apply_to_each_-_Sales_records')
- Assuming you’ve named your loop action
-
Add a Dataverse
Get row by IDaction.- Table name: Products (or your equivalent table)
- Row ID: use the Product lookup from each sales row.
- e.g.
@{items('Apply_to_each_-_Sales_records')?['_hw_product_value']}
- e.g.
- Select columns:
hw_name, hw_unitprice
-
Add a
Set Variableaction to build Current Sale Record object.{"BusinessName": @{items('Apply_to_each_-_Sales_records')?['hw_businessname']},"Date": @{items('Apply_to_each_-_Sales_records')?['hw_date']},"Discount": @{items('Apply_to_each_-_Sales_records')?['hw_discountoff']},"UnitsSold": @{items('Apply_to_each_-_Sales_records')?['hw_unitssold']},"Product": {"Name": @{outputs('Get_Product_row_by_ID')?['body/hw_name']},"UnitPrice": @{outputs('Get_Product_row_by_ID')?['body/hw_unitprice']}}}Property Description BusinessName Business Name column of current Sales record Date Date column of current Sales record Discount Discount column of current Sales record UnitsSold Units Sold column of current Sales record Product.Name Name column of related Product record Product.UnitPrice Unit Price column of related Product record -
Add an
Append to array variableaction to append the Current Sale Record to Sales Records array.- Name: Sales Records
- Value: Variable
Current Sale Record
5. Generate Week‑to‑date Sales Digest with Build a Doc
We will use Build a Doc to generate the Week‑to‑date Sales Digest Excel file from template, filling in the Sales Records data into the defined slots.
Steps:
-
Add a SharePoint
Get file contentaction to get the Excel template file.- Site Address: Use the dropdown to select your SharePoint site.
- File Identifier: Use file browser to select your Excel digest template file.
-
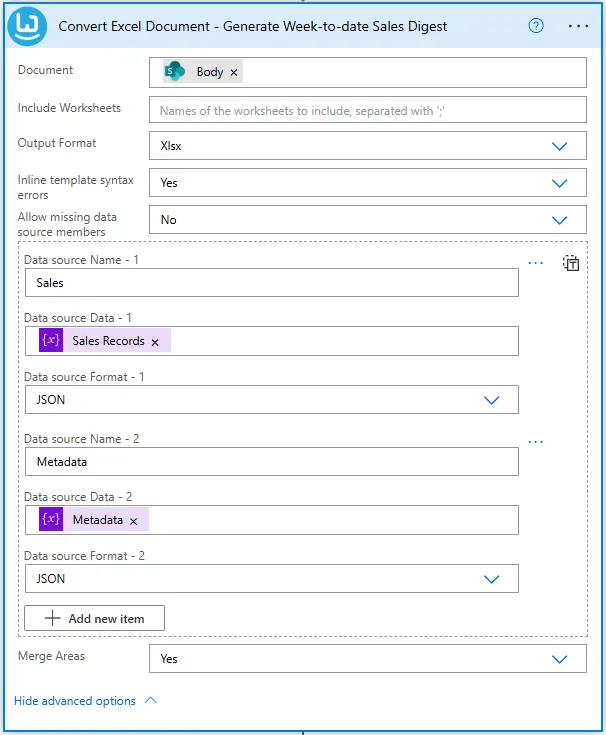
Add a Build a Doc
Convert Excel Documentaction.- Output Format: Xlsx
- Document: Template file content from step 5.1.
- Data Sources:
-
Data source 1
- Name: Sales
- Data: Variable
Sales Records - Format: JSON
-
Data source 2
- Name: Metadata
- Data: Variable
Metadata - Format: JSON
-
The Data Sources input should look like this:
[{"Name": "Sales","Data": @{variables('Sales Records')},"Format": "JSON"},{"Name": "Metadata","Data": @{variables('Metadata')},"Format": "JSON"}]
-
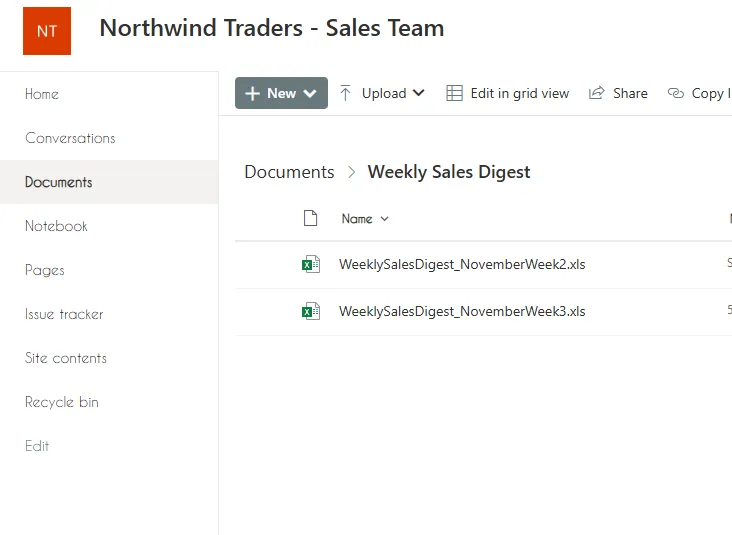
- Add a SharePoint
Create fileaction to save the generated digest to SharePoint.-
Site address: Use the dropdown to select your SharePoint site.
-
Folder path: Use the dropdown to select the folder to save the digest (e.g., /Documents/Reports/)
-
File name:
@{outputs('File_base_name')}.xlsx -
File content: Document output from Build a Doc
Convert Excel Documentaction in step 5.2. -
Configure overwrite behaviour:
Default behaviour of the SharePoint
Create fileaction is to fail if the file already exists.
We want to instead overwrite the existing file if the digest for this week already exists in order for the digest to update daily.
To do this, we need to turn off the ‘Allow chunking’ setting, by doing the following:- Click the ellipsis (…) on the SharePoint
Create fileaction and select ‘Settings’.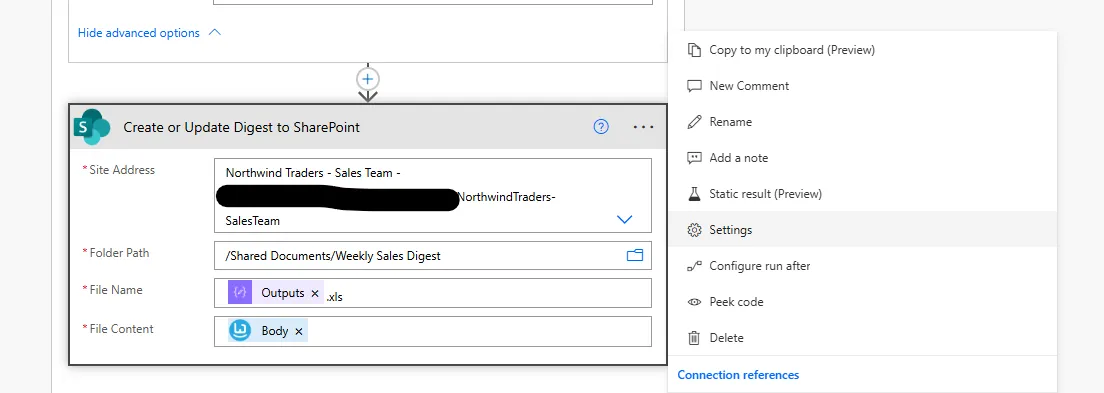
- In the settings pane, under ‘Content Transfer’, turn off the ‘Allow chunking’ toggle.
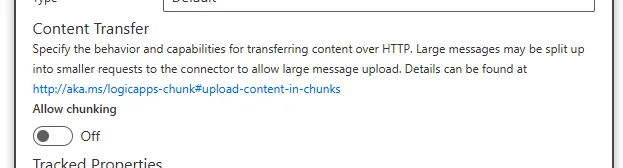
- Click the ellipsis (…) on the SharePoint
-
6. Extract Chart and Generate Email Body with Build a Doc
We will extract the chart from the generated digest as image, and along with metadata, embed into the HTML email body generated from template with Build a Doc.
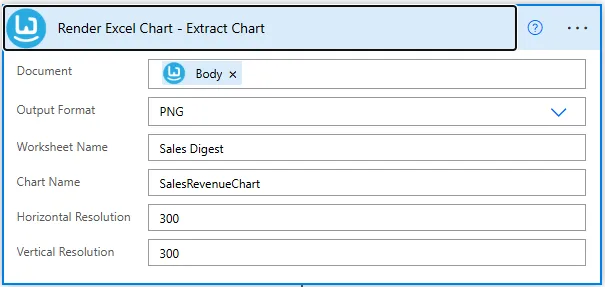
- Add a Build a Doc
Render Excel Chartaction to extract the chart.
This returns a PNG format base64 string for later embedding.
- Document: Body of the digest Excel generated in step 5.2.
- e.g.
@{body('Convert_Excel_Document_-_Generate_Weekly_Sales_Digest')}
- e.g.
- Output format: PNG
- Worksheet name: The worksheet containing the chart.
- e.g. Sale Digest
- Chart name: The name of the chart object to extract.
- e.g. SalesRevenueChart
- Horizontal Resolution and Vertical Resolution: As needed (e.g., 300)
-
Add a SharePoint
Get file contentaction to get the HTML email body template file.- Site Address: Use the dropdown to select your SharePoint site.
- File Identifier: Use file browser to select your HTML email body template file.
-
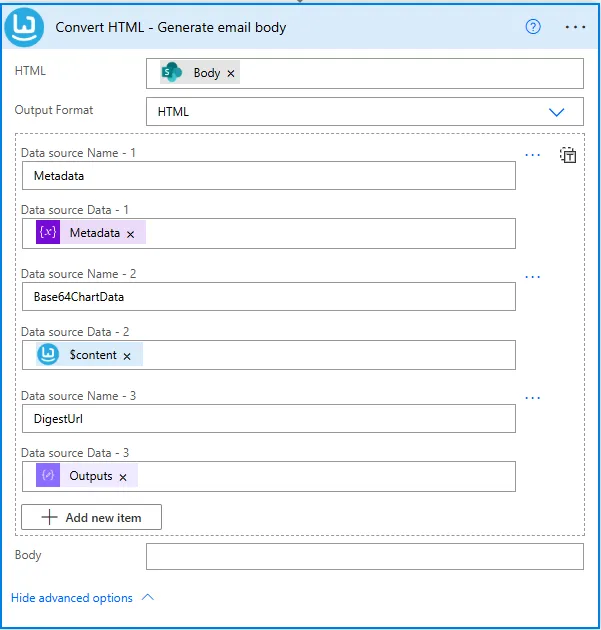
Add a Build a Doc
Convert HTMLaction to populate template slots with data.
- HTML: The email template content from step 6.2.
- e.g.
@{body('Get_email_body_template_file')}
- e.g.
- Output format: HTML
- Data Sources:
- Data source 1
- Name: Metadata
- Data: Variable
Metadata
- Data source 2
- Name: Base64ChartData
- Data:
$contentfield of the Build a DocRender Excel Chartaction output from step 6.1.- e.g.
@body('Render_Excel_Chart_-_Extract_Chart')?['$content']
- e.g.
- Data source 3
- Name: DigestUrl
- Data: Link to the folder containing the weekly digests in SharePoint.
You can construct this URL by concatenating your SharePoint site URL and the document library folder path.- e.g.
https://contoso.sharepoint.com/sites/YourSite/Documents/WeeklySalesDigest/
- e.g.
- Data source 1
7. Send Email
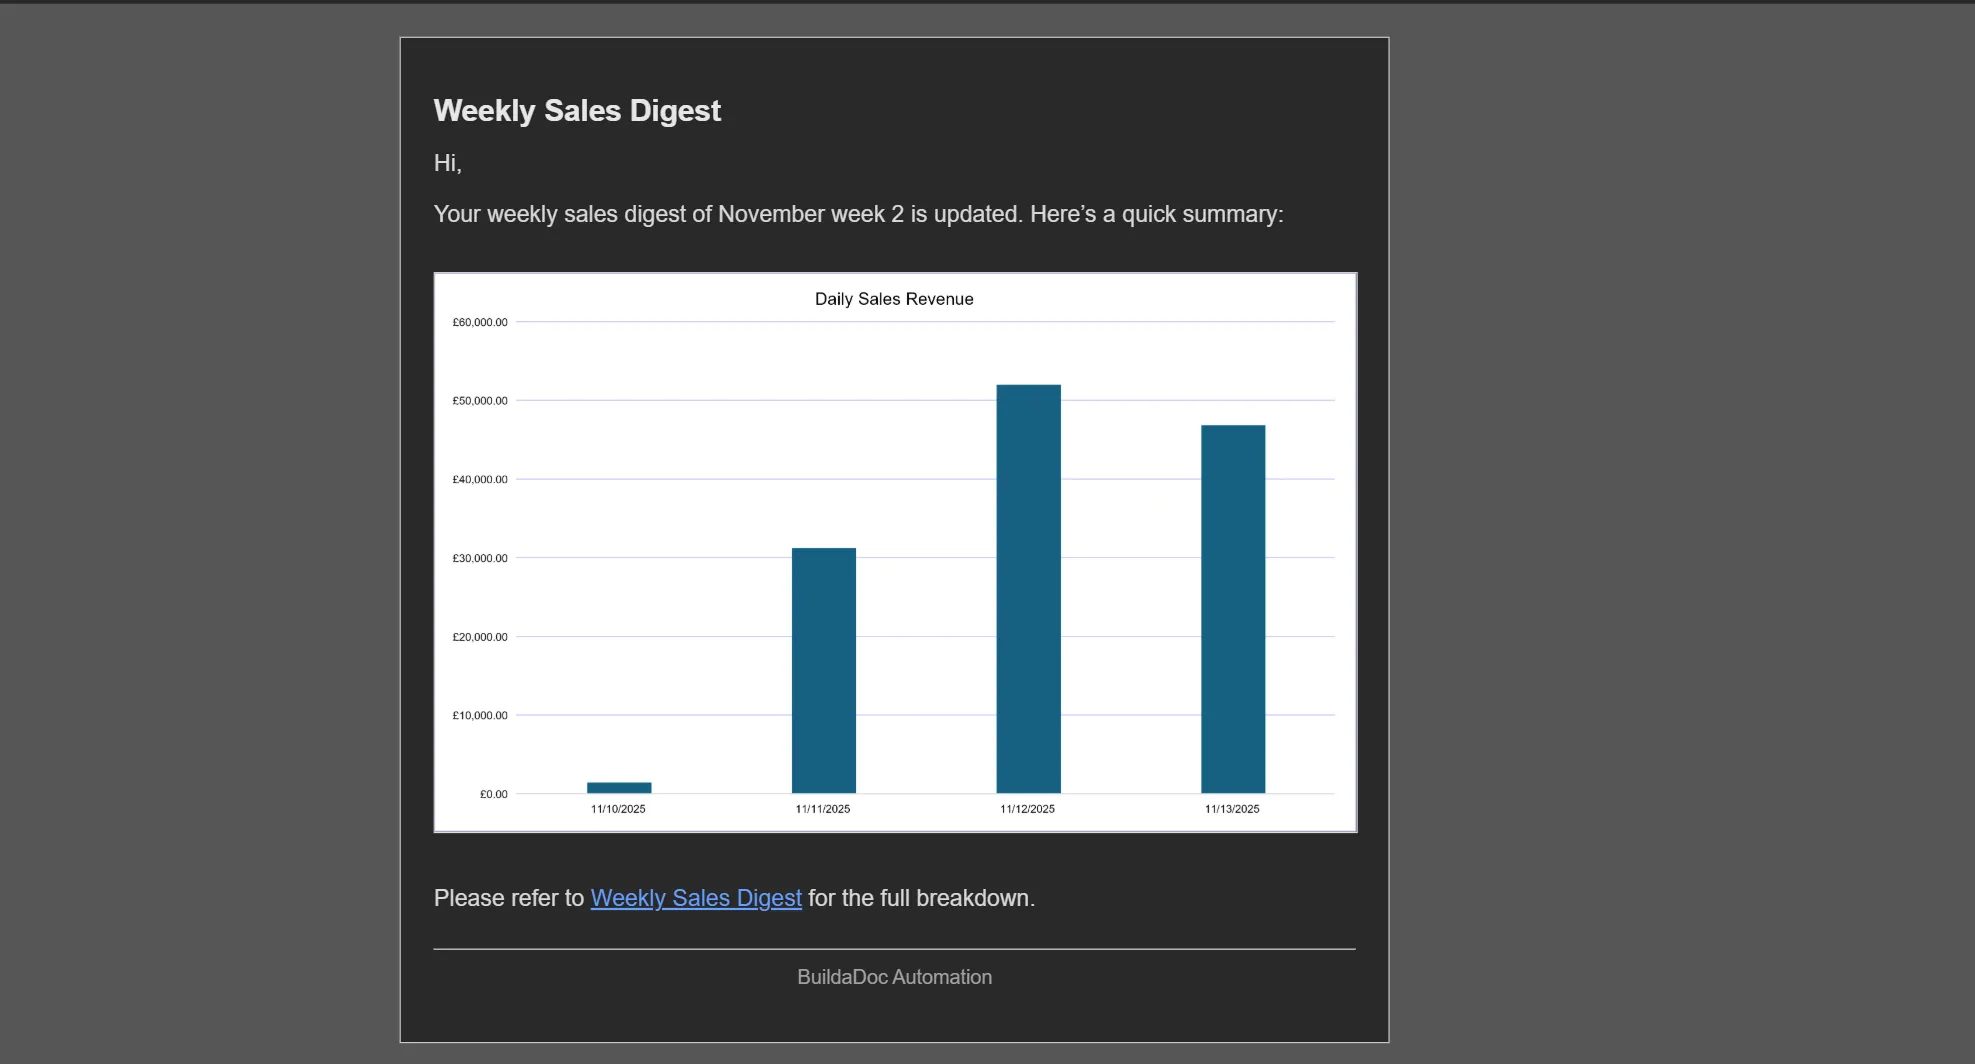
We now have everything we need to send the users the email containing:
- An email body styled in HTML
- An embedded chart image
- A link to the full Excel report
You can use the Office 365 Outlook Send an email (V2) action to send the email.
- Subject: “Week‑to‑date Sales Digest”
- To/CC: Email addresses of the users to receive the digest.
- Body: HTML output from Build a Doc
Convert HTMLaction in step 6.3.- e.g.
@{body('Convert_HTML_-_Generate_email_body')}
- e.g.
Result
Every morning at 8 AM
- An up-to-date Week‑to‑date Sales Digest is generated and stored into SharePoint
- The users receive an email including digest chart and link to full report
Power Automate Flow Overview
- Scheduled trigger - Run daily at specified time
- List Dataverse records - Get this week’s sales data
- Convert Excel Document - Generate the digest with sales data
- Render Excel Chart - Extract the chart as base64 PNG
- Create file in SharePoint - Store the digest file
- Convert HTML - Build the email body with chart and link
- Send email - Deliver to management